I process complex data into
easy-to-understand stories
Data is the new gold. Make your treasures shine! I will help you.
My services
I have specialized in the processing of data, especially visualizing them. Make me your partner in the following areas (among others):

Data Analysis
Unfortunately, unstructured data is not very helpful. I support you in giving structure to your data and making it readable in order to be able to identify potentials as well as risks at an early stage.

Data Visualization

Maintenance
I help you to keep your data up to date, whether by manual updates at defined intervals or by setting up regular automatic updates.

Data Cleansing
Sometimes it is helpful to part with old data sets that have become superfluous. I use specialized tools to help you identify and remove them.

Data Migration to new systems
Have you decided to switch to a new IT system? I will help you to export your old data from the previous system, to standardize it (formats etc.) and to import it into the new database.
Example of a Data Visualization
This is an example of a data visualization based on Tableau. In this case, it is a KPI dashboard for an internationally operating trading company. Try out the interactive features, such as filters (e.g., year [Jahr], category [Kategorie], etc.) or buttons for different views (e.g., regions [Regionen] or customers [Kunden])!
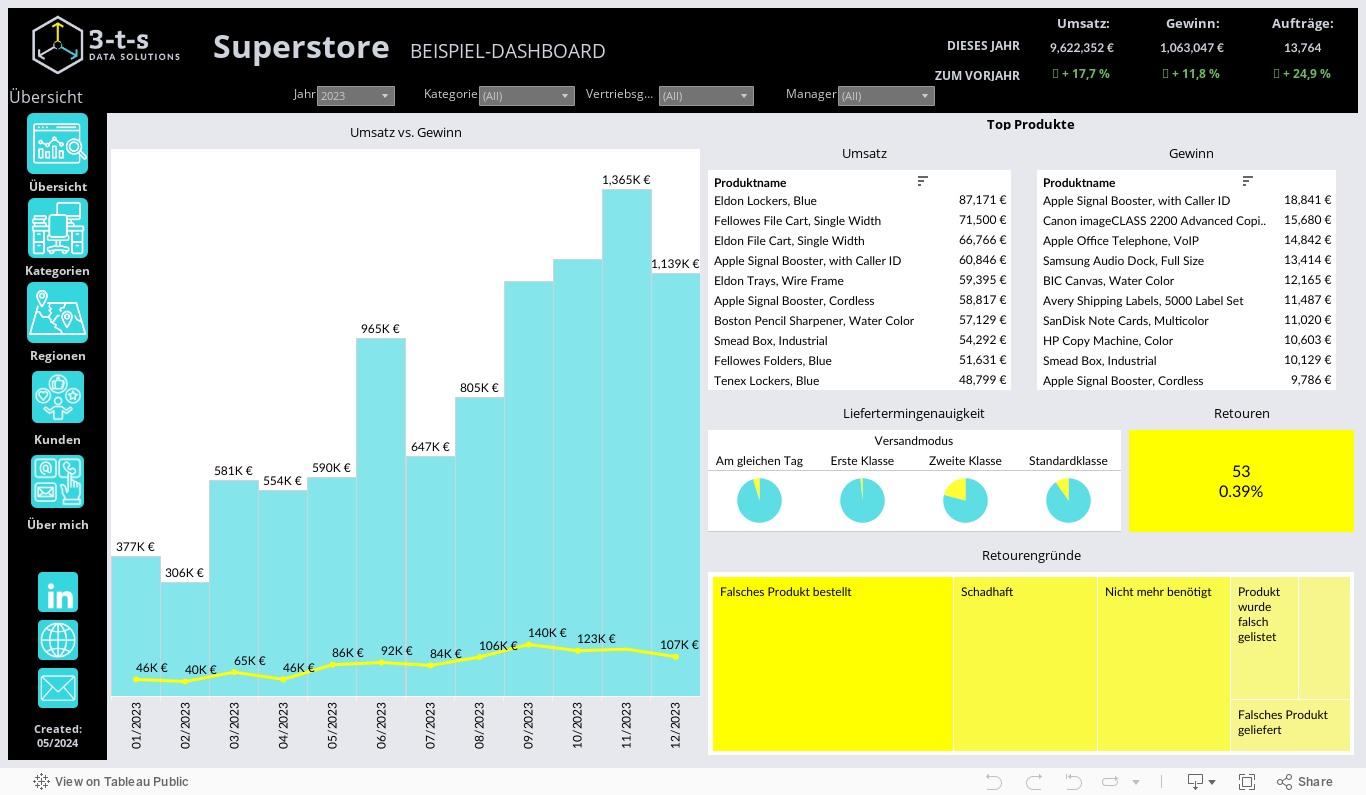

I work with the market leader
With Tableau, I use the world’s leading platform for modern business intelligence solutions, which allows data to be captured, analyzed and visually displayed from almost any system.
Let us start together to make your strengths and potentials visible!
Together we develop a concept to optimally exploit the potential of your data and make your day-to-day business easier.

My process
For projects I use a 5-phase process. This supports me in being able to present initial results at an early stage and to achieve the optimal result for you in the end.


Phase 1 – Objectives

Phase 2 – Evaluation
I evaluate your existing systems and data (analog + digital) in order to incorporate exactly the information into the project that will help you in your day-to-day business.

Phase 3 – Data Cleansing and Data Analysis
I clean up the relevant data and bring it into a usable structure in order to make it easier for you to evaluate and read it in the future. Missing data may be added and certain criteria filtered.

Phase 4 – Development

Phase 5 – Handover
In the last project phase, I train you to enable you to use the developed solution simply and purposefully. You will receive the documentation and can decide whether you want to take the project completely into your own hands from now on or whether I should continue to update your data on your behalf at regular intervals.
Contact me
Send me a message, give me a call or arrange an appointment directly.
I look forward to meeting you.